Un ordinateur n’est au final qu’une grosse calculatrice avec plusieurs avantages:
Il est extrêmement commun pour un ingénieur d’utiliser un ordinateur pour effectuer des calculs. L’utilisation de Python dans ce domaine est très répandue dans le monde professionnel.
numpyBibliothèque à installer
Permet de travailler très efficacement avec des vecteurs de nombres
Incontournable pour le calcul numérique en Python
numpyUtilisation d’un alias pour l’import
import numpy as np
Création d’un vecteur
v = np.array([1, 1, 3])
Opérations
print(2*v) # Multiplication par un scalaire print(v+v) # Somme print(v.dot(v)) # Produit scalaire print(v @ v) # Produit scalaire v2 = np.array([2, -1, 2] print(np.cross(v, v2))) # Produit vectoriel print(np.linalg.norm(v)) # Norme
np.array([1, 2, 3]) np.zeros(5) np.ones(10) np.random.random(10) np.random.randn(10) np.linspace(0, 10, 5) np.arange(0, 10, 0.2)
Entre vecteur et scalaire
a = np.array([1, 2, 3, 4]) a + 1 # [2, 3, 4, 5] 2 * a # [2, 4, 6, 8] a ** 2 # [1, 4, 9, 16] 1 / a # [1.0, 0.5, 0.3333, 0.25] a < 3 # [True, True, False, False]
Entre vecteurs de même taille élément par élément
a = np.array([1, 2, 3, 4]) b = np.array([5, 6, 7, 8]) a + b # [6, 8, 10, 12] a * b # [5, 12, 21, 32]
x = np.array([1, 2, 3]) # Fonction standard ne marche pas y = math.sin(x) # Error # Fonction vectorisée existe dans numpy y = np.sin(x)
La plupart des opérations de base sont déjà supportées par numpy.
Mais il est facile de créer des fonctions vectorisées:
@np.vectorize def fun(a, b): if a > b: return 1 return -1 x = np.array([1, 2, 3]) y = np.array([3, 2, 1]) print(fun(x, y))
numpy: Calcul Matricielnumpy permet aussi de travailler avec des matricesA = np.array([[1, 2], [3, 4]])
Opérations avec scalaires
A = np.array([[1, 2], [3, 4]]) 2*A #[[2, 4], # [6, 8]]
Opérations avec tableaux de même taille et produit matriciel
B = np.array([[5, 6], [7, 8]]) A * B # produit élément par élément A @ B # produit matriciel
Fonctions sur les tableaux
np.sin(A) # [[ 0.84147098 0.90929743] # [ 0.14112001 -0.7568025 ]]
x = np.array([[1, 2], [3, 4], [5, 6]]) x.ndim # Dimension => 2 x.shape # Forme => (3, 2) x.size # Nombre total d’éléments => 6 x.dtype # Type de données stockées => dtype('int32')
x = np.array([[1, 2], [3, 4], [5, 6]]) x[0, 1] # x[0][1] => 2 # Slice x[:2, 1] # [2, 4] x[[0, 2], :] # [[1, 2], [5, 6]] # Indexation booléenne x[[[True , False], [False, True ], [True , True ]]] # [1, 4, 5, 6] x[x < 4] # [1, 2, 3] # Edition conditionnelle x[x < 4] = 0 # [[0, 0], # [0, 4], # [5, 6]]
x = np.array([[1, 2], [3, 4], [5, 6]]) x.reshape((2, 3)) # [[1, 2, 3], # [4, 5, 6]] x.flatten() # [1, 2, 3, 4, 5, 6] x.diagonal() # [1, 4] x.trace() # 5 x.sum(axis=1) # [3, 7, 11] y = x.transpose() # [[1, 3, 5], # [2, 4, 6]]
matplotlib à
installernumpyImporter matplotlib
from matplotlib import pyplot as plt
Importer numpy
import numpy as np
Créer les abscisses des échantillons
# 100 valeurs entre -2 et 2 x = np.linspace(-5, 5, 100)
Calculer les ordonnées
# np.sin est la version vectorisée de sin y = np.sin(x)
Dessiner le graphique
plt.figure() plt.plot(x, y) plt.show()
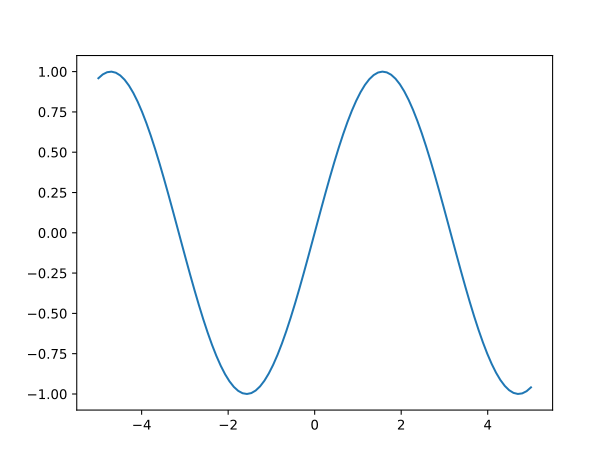
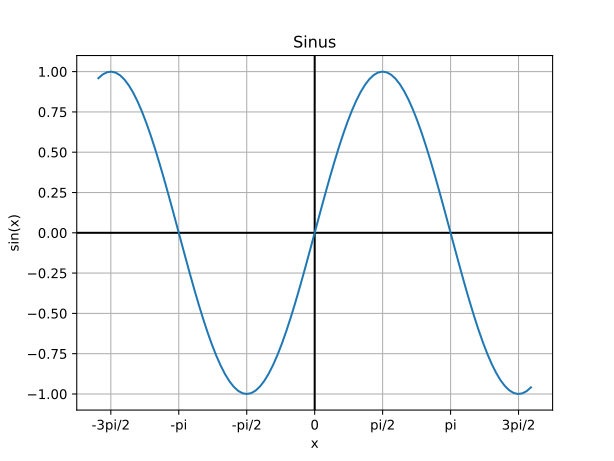
from matplotlib import pyplot as plt import numpy as np x = np.linspace(-5, 5, 100) y = np.sin(x) plt.figure() plt.title("Sinus") # Donne un titre à la figure plt.xlabel("x") # Affiche un nom sur l'axe des x plt.ylabel("sin(x)") # Affiche un nom sur l'axe des y plt.grid() # Affiche une grille # Configure les graduations de l'axe des x plt.xticks( [-3*np.pi/2, -np.pi, -np.pi/2, 0, np.pi/2, np.pi, 3*np.pi/2], # positions labels=["-3pi/2", "-pi", "-pi/2", "0", "pi/2", "pi", "3pi/2"] # étiquettes ) plt.axhline(color="k") # Affiche une ligne noire pour l'axe des x plt.axvline(color="k") # Affiche une ligne noire pour l'axe des y plt.plot(x, y) plt.show()
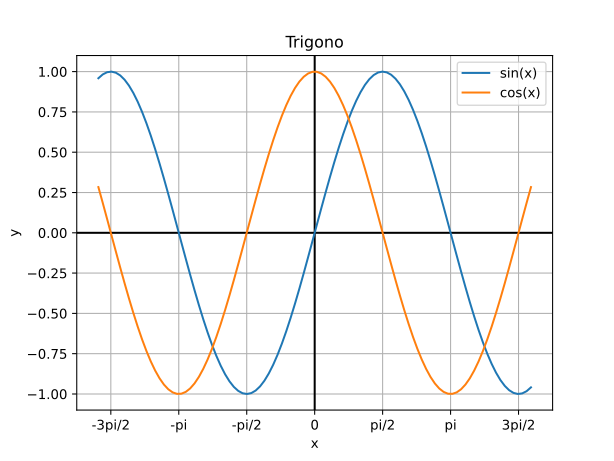
from matplotlib import pyplot as plt import numpy as np x = np.linspace(-5, 5, 100) ysin = np.sin(x) ycos = np.cos(x) plt.figure() plt.title("Trigono") plt.xlabel("x") plt.ylabel("y") plt.grid() plt.xticks( [-3*np.pi/2, -np.pi, -np.pi/2, 0, np.pi/2, np.pi, 3*np.pi/2], labels=["-3pi/2", "-pi", "-pi/2", "0", "pi/2", "pi", "3pi/2"] ) plt.axhline(color="k") plt.axvline(color="k") plt.plot(x, ysin, label="sin(x)") # on donne une étiquette à la courbe plt.plot(x, ycos, label="cos(x)") # on donne une étiquette à la courbe plt.legend() # on demande d'afficher la légende plt.show()
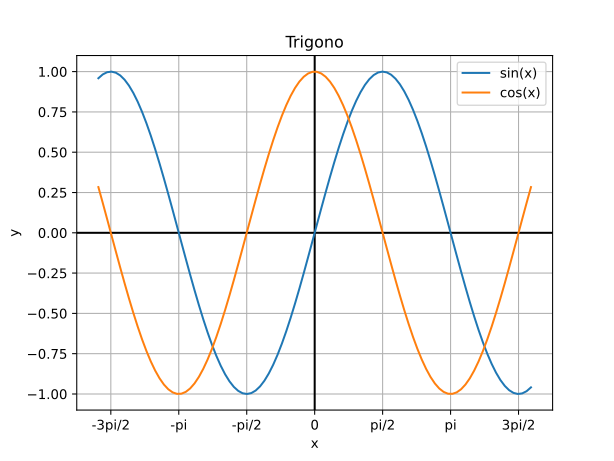
matplotlib deux APIfrom matplotlib import pyplot as plt import numpy as np x = np.linspace(-5, 5, 100) ysin = np.sin(x) ycos = np.cos(x) fig, ax = plt.subplots() ax.set_title("Trigono") ax.set_xlabel("x") ax.set_ylabel("y") ax.grid() ax.set_xticks([-3*np.pi/2, -np.pi, -np.pi/2, 0, np.pi/2, np.pi, 3*np.pi/2], labels=["-3pi/2", "-pi", "-pi/2", "0", "pi/2", "pi", "3pi/2"]) ax.axhline(color="k") ax.axvline(color="k") ax.plot(x, ysin, label="sin(x)") ax.plot(x, ycos, label="cos(x)") ax.legend() plt.show()
plt.subplot(1, 2, 1) plt.plot([1, 2, 3], [0, 0.5, 0.2]) plt.subplot(1, 2, 2) plt.plot([3, 2, 1], [0, 0.5, 0.2]) plt.suptitle('Implicit Interface') for i in range(1, 3): plt.subplot(1, 2, i) plt.xlabel('Boo') plt.show()
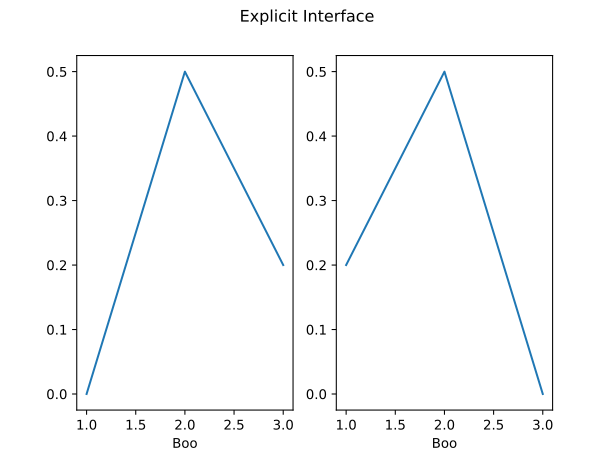
fig, axs = plt.subplots(1, 2) axs[0].plot([1, 2, 3], [0, 0.5, 0.2]) axs[1].plot([3, 2, 1], [0, 0.5, 0.2]) fig.suptitle('Explicit Interface') for i in range(2): axs[i].set_xlabel('Boo') plt.show()
Algorithmes et fonctions utilitaires construits sur numpy
De nombreuses fonctionnalités
Installation
scipy intègre la recherche dichotomique vue l’année
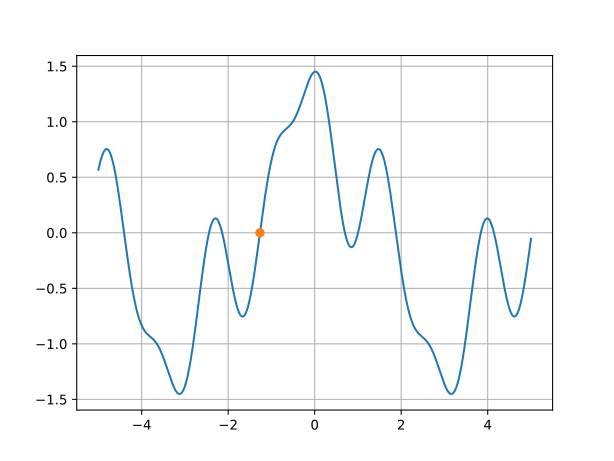
passéefrom scipy import optimize def fun(x): return np.cos(x)+np.cos(3*x+1)/2+np.cos(5*x-1)/3 root = optimize.bisect(fun, -2, 0, xtol=0.00001) # xtol = 2e-12 par défaut print(root) # affiche -1.2646560668945312 x = np.linspace(-5, 5, 1000) plt.figure() plt.plot(x, fun(x)) plt.plot(root, 0, "o") # affiche un point sur la figure plt.grid() plt.show()
from scipy import optimize def fun(x): return np.cos(x)+np.cos(3*x+1)/2+np.cos(5*x-1)/3 root = optimize.newton(fun, -1) print(root) # -1.2646564339411952
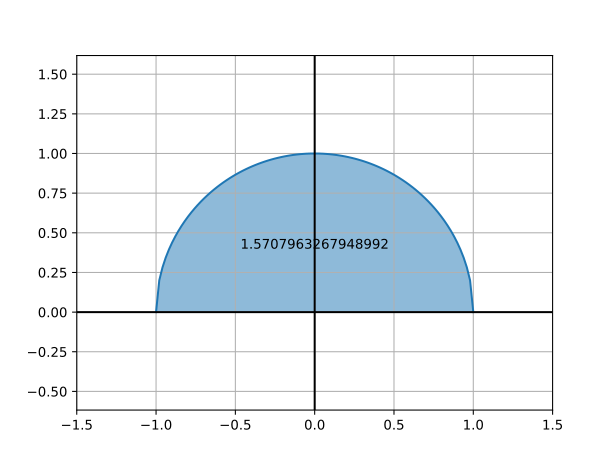
integrate.quadfrom scipy import integrate def fun(x): return np.sqrt(1 - x**2) result = integrate.quad(fun, -1, 1) print(result) # (pi/2, erreur) x = np.linspace(-1, 1, 100) y = fun(x) plt.figure() plt.fill_between(x, y, alpha=0.5) # colorie l'aire sous la courbe plt.plot(x, y) plt.grid() plt.axis("equal") # même échelle sur les 2 axes plt.xlim(-1.5, 1.5) # limites de l'axe x plt.axhline(color="k") plt.axvline(color="k") plt.annotate(str(result[0]), xy=(0, 0.4), ha="center") # ajoute un texte plt.show()
import numpy as np from scipy import linalg A = np.array([[1 , 2] , [3 , 4]]) b = np.array([[5] , [6]]) A.T # transpose linalg.det(A) # déterminant linalg.inv(A) # inverse A @ b # produit matriciel
import numpy as np from scipy import linalg A = np.array([[1 , 2] , [3 , 4]]) b = np.array([[5] , [6]]) linalg.inv(A).dot(b) linalg.solve(A, b)
Équation différentielle avec conditions initiales
Avec scipy
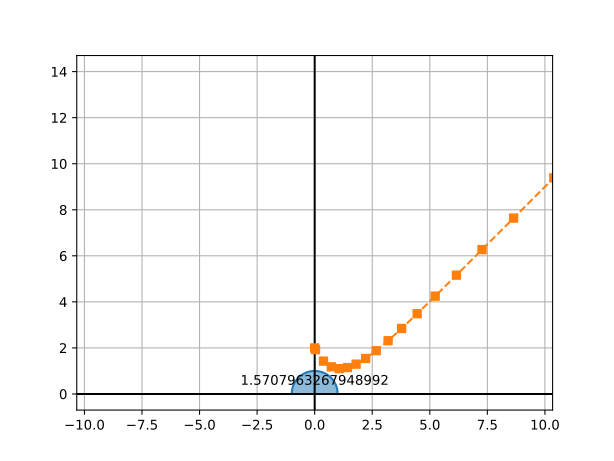
from matplotlib import pyplot as plt from scipy.integrate import solve_ivp import numpy as np def fun(t: float, y: float) -> float: return t-y sol = solve_ivp( fun=fun, t_span=[0, 15], y0=[2], rtol = 1e-5 ) plt.plot(sol.t, sol.y[0], '--s') plt.show()
solve_ivp ne supporte que le premier
ordre mais il supporte les systèmes
d’équations différentielles
Nous pouvons poser que et réécrire l’équation sous forme d’un système du premier ordre
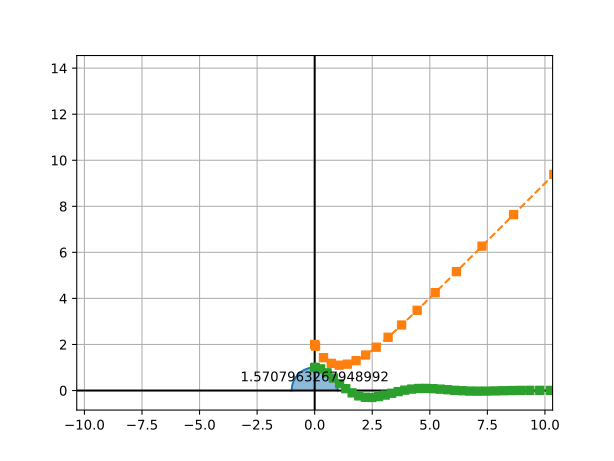
from matplotlib import pyplot as plt from scipy.integrate import solve_ivp import numpy as np def fun(t: float, Y: list[float]) -> list[float]: """ Args: - `Y`: `Y[0]` is the value of `y(t)` `Y[1]` is the value of `g(t)` - `t`: is just the value of `t` Returns: A list with the value `y'(t)` and `g'(t)` """ return [Y[1], -2*Y[0]-Y[1]] sol = solve_ivp( fun=fun, t_span=[0, 15], y0=[1, 0], # Conditions initiales pour y(t) et g(t) rtol = 1e-5 ) plt.plot(sol.t, sol.y[0], '--s') plt.show()
pandasnumpypandas permet d’importer de multiples formats
de données.import pandas as ps dataframe = ps.read_excel("foo.xlsx") print(dataframe)
dataframe["total"] = ( dataframe["project"] + dataframe["exam"] + dataframe["labs"] ) / 3 print(dataframe)
dataframe.to_json("students_with_total.json")
numpy : https://numpy.org/doc/stable/matplotlib : https://matplotlib.org/stable/index.htmlscipy : https://docs.scipy.org/doc/scipy/pandas : https://pandas.pydata.org/docs/